A Deep Dive into the Greeks
A detailed breakdown of the options Greeks (Delta, Theta, Vega, Gamma, and Rho) and how they affect option pricing and strategy.
Overview
Continuation of Why Stock Options are Beautiful.
When you look at an option price, most of the number is not just “how far is the stock from the strike”. A $185 call on Nvidia at $180 doesn’t cost $5. It might cost $12. The extra $7 comes from time, volatility, and expectations. The Greeks are what break that price down into its moving parts.
They come from the Black-Scholes model (1973), which is the standard formula for pricing European-style options. It takes five inputs: stock price, strike price, time to expiration, risk-free interest rate, and implied volatility. It spits out a fair value. Real market prices drift from that based on supply and demand, but everything else builds on top of it.
The Greeks I believe most people use regularly are Delta, Theta, Vega, and Gamma. Rho exists but you can mostly ignore it unless you’re trading LEAPS.
I’ll be using the same Nvidia example throughout: NVDA is at $180, and Bob bought a $185 call expiring in 45 days for $12 per share ($1,200 total).
Delta (Δ)
Delta tells you how much your option moves for every $1 move in the stock. A delta of 0.40 means if Nvidia goes up $1, your option gains $0.40 per share ($40 per contract).
- Calls have positive delta (0 to 1). Puts have negative delta (-1 to 0).
- ATM options sit around ±0.50.
- Deep ITM options approach ±1.00, they basically move like the stock. You can pretend that you are holding actual stock with respect to its movement.
- Far OTM options approach 0, barely reacting to price moves. But as the stock rises toward the strike, delta grows (via gamma), so the gains accelerate. A $50 OTM contract can turn into $500 on a big move, but it can also just expire worthless if the stock never gets there. The low delta reflects the low probability of that happening.
Delta also doubles as a rough probability of expiring ITM. A 0.30 delta call has roughly a 30% chance of being ITM at expiration, but I never really like this metric as the actual result varies based on a bunch of external conditions/factors.
Another way to think about delta: it tells you how many shares your option position is equivalent to. Bob’s 0.40 delta call behaves as if he’s holding 40 shares of Nvidia. If Nvidia goes up $1, he gains $40 (0.40 x 100 shares). If he had a 0.80 delta call, it would behave like holding 80 shares. This is why deep ITM options (delta close to 1.00) are sometimes used as a cheaper substitute for owning the stock outright.
For Bob (bought the $185 call at $180): his call has a delta of about 0.40, so he’s effectively long 40 shares of Nvidia. Nvidia moves up $5 to $185. His option gains roughly $2 per share, so he’s up about $200 on a $1,200 position. As the stock keeps moving above $185, the option goes ITM and delta climbs toward 0.60, 0.70, eventually 1.00 if it goes deep ITM. At that point the option moves dollar-for-dollar with the stock.
For Alice (sold the $185 call): her delta is -0.40, so she’s effectively short 40 shares of Nvidia. Every $1 Nvidia goes up costs her $40. If she also owns 100 shares of Nvidia, those shares offset her short delta from the call, which is exactly the setup in a covered call.
Delta doesn’t stay fixed, it changes as the stock moves (Gamma, which is covered below).
Theta (Θ)
Theta is time decay. It’s how much value your option loses per day just from time passing, with everything else held constant.
If Bob’s $1,200 call has a theta of -0.08, it loses $0.08 per share ($8 per contract) per day. That doesn’t sound like much, but it adds up fast. Over 45 days, if Nvidia just sits at $180 and nothing else changes, that option will slowly drop toward zero.
- Theta is always negative for buyers, always positive for sellers.
- It is not linear. It’s slow early on and accelerates hard in the last 30 days. (This makes the time period around 10-45 days a great expiry to choose when selling options 🙂)
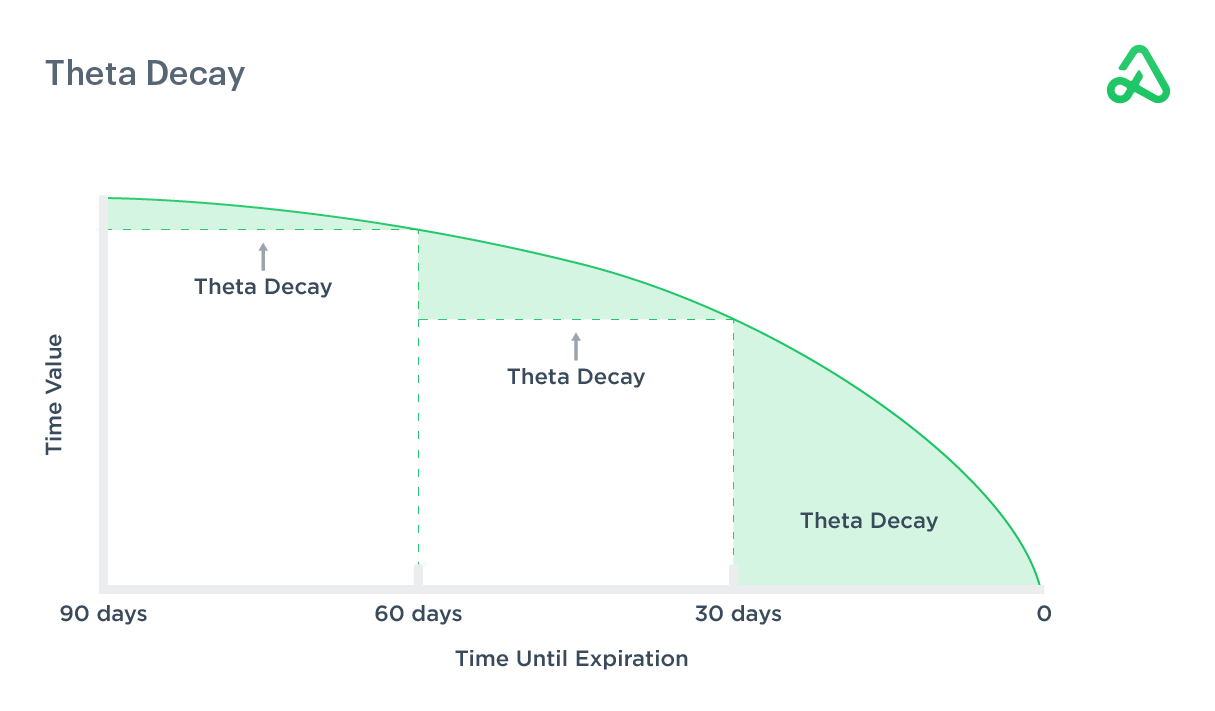 Source: Option Alpha
In the first two weeks, Bob might only lose $8-10/day. But in the final week before expiration, that same option might be losing $30-40/day even if Nvidia doesn’t move. This is why buying OTM options and just waiting is a bad idea (in my opinion). Time is working against you every single day, and the probability of expiring worthless is higher than otherwise so it’s pretty much a gamble.
For sellers it’s the opposite. If you sold a covered call on Nvidia at $185 and it just sits there, you’re collecting theta every day. Most sellers close at 50% profit (the $1,200 call is now worth $600) and move on. No need to hold all the way to expiration and deal with the gamma risk that comes with it.
Vega (V)
Vega measures how much the option price changes for every 1% change in implied volatility (IV). It’s annualized, but can be adjusted to reflect the time remaining until a specific option’s expiration (e.g., 30-day or 60-day IV).
IV is basically the market’s fear gauge for a specific stock. It’s not measuring how much the stock has moved, it’s measuring how much the market expects it to move. When something uncertain is coming up (earnings, Fed announcements, lawsuits, wartime things etc), traders buy options to hedge or speculate. That extra demand drives option prices up. IV is the number that captures that, it rises when options are in demand and falls when they’re not. High IV = expensive options. Low IV = cheap options.
Vega tells you how sensitive your option is to IV changing. Bob’s call might have a vega of 0.15. If IV rises by 1%, the option gains $0.15 per share ($15 per contract). If IV drops by 1%, it loses that amount.
IV crush is the trap most people fall into (I got wrecked by this many times at the start too 🗿). Say Nvidia is at $180 and earnings are next week. People are anticipating big moves, so IV spikes to 80% (due to surge in demand). Bob buys a call for $1,200. Earnings come out, Nvidia rallies 5% to $189. In theory he should have made a good amount of money right? Since he bought calls and the stock price went up. But IV collapses from 80% to 30% right after that (the crush). The delta gain from the $9 move was offset by the vega loss from IV dropping 50 points. Bob might be breaking even or might even be losing money 💀.
To prevent: When buying, buy when IV is low relative to its historical IV. If you’re selling, sell when IV is high. IV rank (IVR) is what most platforms show. An IVR of 80 means today’s IV is in the 80th percentile of its 52-week range. That’s a good time to be a seller.
Gamma (Γ)
Gamma is the rate of change of delta. It tells you how fast delta moves as the stock price moves.
Say Bob’s call has a delta of 0.40 and a gamma of 0.05 and Nvidia moves up $1. His delta increases from 0.40 to 0.45. Another $1 up and it becomes 0.50. Gamma is why a small move near ATM can snowball into a big option move.
- Gamma is highest for ATM options and near expiration.
- Deep ITM and deep OTM options have low gamma, delta is more stable there.
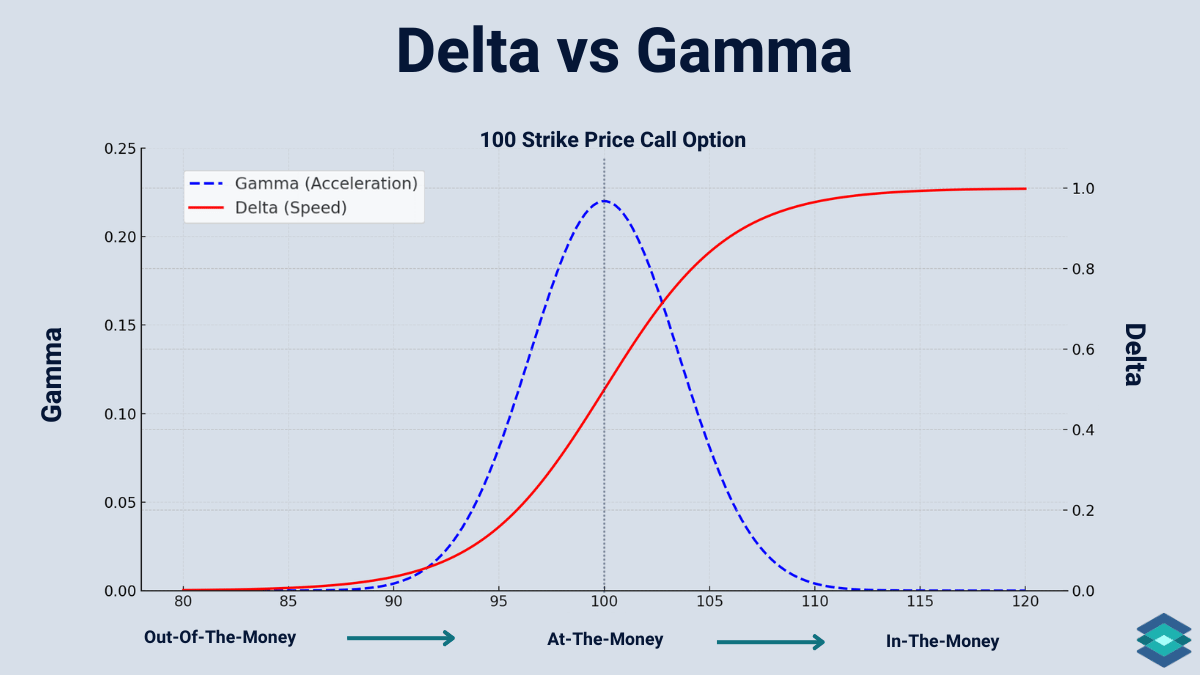 Source: TradingBlock Options Greeks Calculator
For buyers it’s good. If Nvidia starts rallying, each dollar up increases your delta, so you gain faster and faster. A $10 move in your favor in the last few days can turn a $0.05 option into a $1.00 option.
For sellers it’s bad (or rather scary). If you sold the $185 call and expiration is tomorrow, a 3% Nvidia rally can rapidly push it deep ITM. The delta exposure changes too fast. This is why most sellers close short options early rather than holding into the last few days. The gamma risk near expiration is just not worth it for the small remaining premium.
0DTEs have the highest gamma of anything. When an option expires the Delta must transition to a state of either 0 (worthless) or 1 (full ITM). Because there is no more time value left, Delta must adjust instantly to reflect this. Since Gamma is the rate of change of Delta, it’s possible to get either crazy returns or lose everything due to huge Gamma spikes.
Rho (ρ)
Rho measures how much the option price changes for every 1% change in interest rates. Honestly I don’t even look at it. It only becomes relevant on very long-dated options like LEAPS. Higher rates increase call prices slightly and decrease put prices slightly, because of the time value of money.
Comments powered by Disqus.